What
is Risk Management?

Risk management refers
collectively to the principles, framework and process of managing risks effectively,
and managing risks refers to the application of these principles, framework and
process to particular risks. Thus organizations manage risk by anticipating,
understanding and deciding whether to modify it, where they communicate and
consult with stakeholders and monitor and review the risk and the controls that
are modifying the risk, throughout this process. All activities of an
organization involve risk, because organizations of any kind face internal and
external factors and influences that make it uncertain whether, when and the
extent to which they will achieve or exceed their objectives. Thus, principles
and practices of risk management can be applied across an entire organization,
to its many areas and levels, as well as to specific issues, functions, projects
& activities.
In last article “ISO
31010 Risk Assessment Methods – I”, we discussed first 6 methods of 31 methods
given in ISO 31010:2011 in detail. Thus we are going to discuss next 6 methods
of the general risk assessment methods given there. The next articles will
discuss rest of the 19 methods in upcoming 3 articles.
6. Hazard and Operability Studies (HAZOP)
HAZOP aims to
stimulate the imagination of participants to identify potential hazards and
operability problems where structure and completeness are given by using
guide-word prompts. The HAZOP technique was initially developed to analyze
chemical process systems and mining operation process which has been later extended
to other types of systems and also to complex operations such as nuclear power
plant operation and to use software to record the deviation and consequence.
Needless to say, HAZOP is intended high risk organizational contexts where
appropriate levels of resource need to be available to support its use.

Objective of
carrying out a HAZOP study:
To
check a design
To
decide whether and where to build
To
decide whether to buy a piece of equipment
To
obtain a list of questions to put to a supplier
To
check running instructions
To
improve the safety of existing facilities
A Hazard and
Operability Study systematically investigates each element in a process. The
goal is to find potential situations that would cause that element to pose a
hazard or limit the operability of the process as a whole. There are four basic
steps to the process:
1.
Forming a HAZOP team
2.
Identifying the elements of the system
3.
Considering possible variations in operating parameters
4.
Identifying any hazards or failure points
Once the four steps
have been completed, the resulting information can lead to improvements in the
system. The best way to apply the results of a HAZOP study will depend on the
nature of the system.
Step 1: Form a
HAZOP Team

To perform a HAZOP,
a team of workers is formed, including people with a variety of expertise such
as operations, maintenance, instrumentation, engineering/ process design, and
other specialists as needed. These should not be “newbies,” but people with
experience, knowledge, and an understanding of their part of the system. The
key requirements are an understanding of the system, and a willingness to
consider all reasonable variations at each point in the system.
Step 2: Identify
Each Element and its Parameters
The HAZOP team will
then create a plan for the complete work process, identifying the individual
steps or elements, which typically involves in actual situation of using the
piping and instrument diagrams (P&ID), or a plant model, as a guide for
examining every section and component of a process. For each element, the team
will identify the planned operating parameters of the system at that point:
flow rate, pressure, temperature, vibration, and so on.
Step 3: Consider
the Effects of Variation
For each parameter,
the team considers the effects of deviation from normal. For example, “What
would happen if the pressure at this valve was too high? What if the pressure
was unexpectedly low? Would the rate of change in pressure (delta-p) pose its
own problems here?” Don’t forget to consider the ways that each element
interacts with others over time; for example, “What would happen if the valve
was opened too early, or too late?”
Step 4: Identify
Hazards and Failure Points
Where the result of
a variation would be danger to workers or to the production process, you’ve
found a potential problem. Document this concern, and estimate the impact of
failure at that point. Then, determine the likelihood of that failure; is there
a realistic cause for the harmful variation? Evaluate the existing safeguards
and protection systems, and evaluate their ability to handle the deviations
that you’ve considered.
7. Hazard Analysis and Critical Control Points (HACCP)

HACCP is way of a
systematic preventive approach to food safety from biological, chemical, and
physical hazards in production processes that can cause the finished product to
be unsafe, where HACCP designs measurements to reduce these risks to a safe
level. Thus HACCP has been recognized internationally as a logical tool for
adapting traditional inspection methods to a modern, science-based, food safety
system. HACCP is focused only on the health safety issues of a product ensuring
that risks are minimized by controls throughout the process rather than through
inspection of the end product. However, the principle of identifying the
factors (risks) that can influence product quality, and defining process points
where critical parameters can be monitored and hazards controlled, can be
generalized for use other technical systems. The seven HACCP principles are the
basis of most food quality and safety assurance systems. Further, HACCP
principles are an integral part of the international standard ISO 22000
FSMS 2005 where core safety system is based on HACCP. ISO 22000 standard is a
complete food safety and quality management system incorporating the elements
of prerequisite programs (GMP and SSOP), HACCP and the ISO 9001 quality
management system, which together form an organization’s Total Quality
Management system.
8. Environmental
Risk Assessment
 The environmental risk assessments can be
further divide into toxicological, environmental or ecological risk assessments
based on the specific scenario to be assessed. An ecological risk assessment
tells what happens to a bird, fish, plant or other non-human organism when it
is exposed to a stressor, such as a pesticide. Pathway analysis will be a good
choice as methodology because, that explore different routes by which a target
might be exposed to a source of risk, can be adapted and used across a very
wide range of different risk areas, outside human health and the environment,
and is useful in identifying treatments to reduce risk. The strength of pathway
analysis is that it provides a very detailed understanding of the nature of the
problem and the factors which increase risk. However, it needs good data which
is often not available or has a high level of uncertainty associated with it.
Likewise, it is also resource intensive as is unlikely to find many uses in
quality management systems.
The environmental risk assessments can be
further divide into toxicological, environmental or ecological risk assessments
based on the specific scenario to be assessed. An ecological risk assessment
tells what happens to a bird, fish, plant or other non-human organism when it
is exposed to a stressor, such as a pesticide. Pathway analysis will be a good
choice as methodology because, that explore different routes by which a target
might be exposed to a source of risk, can be adapted and used across a very
wide range of different risk areas, outside human health and the environment,
and is useful in identifying treatments to reduce risk. The strength of pathway
analysis is that it provides a very detailed understanding of the nature of the
problem and the factors which increase risk. However, it needs good data which
is often not available or has a high level of uncertainty associated with it.
Likewise, it is also resource intensive as is unlikely to find many uses in
quality management systems.
9. Structure « What if? » (SWIFT)
 The SWIFT is a
qualitative risk identification technique which was originally developed as a
simpler alternative to HAZOP (Hazard and Operability Studies). SWIFT is a
system for prompting a team to identify risks, normally used within a
facilitated workshop and linked to a risk analysis and evaluation technique. In
addition, SWIFT has been purposely design as a sort of ‘HAZOP Lite’ which needs
fewer resources. ISO 31010 consider the ‘Resources and capability’ requirement
as “Medium”, where it may be a viable risk identification technique for use by
most small to medium as well as larger quality conscious organizations. The
system, procedure, plant item and/or change has to be carefully defined before
the study can commence. Nevertheless, both external and internal contexts need
to be established through interviews and study of documents, plans and drawings
by the facilitator.
The SWIFT is a
qualitative risk identification technique which was originally developed as a
simpler alternative to HAZOP (Hazard and Operability Studies). SWIFT is a
system for prompting a team to identify risks, normally used within a
facilitated workshop and linked to a risk analysis and evaluation technique. In
addition, SWIFT has been purposely design as a sort of ‘HAZOP Lite’ which needs
fewer resources. ISO 31010 consider the ‘Resources and capability’ requirement
as “Medium”, where it may be a viable risk identification technique for use by
most small to medium as well as larger quality conscious organizations. The
system, procedure, plant item and/or change has to be carefully defined before
the study can commence. Nevertheless, both external and internal contexts need
to be established through interviews and study of documents, plans and drawings
by the facilitator.
The facilitator
asks the participants to raise and discuss:
Known risks and
hazards;
Previous experience
and incidents;
Known and existing
controls and safeguards;
Regulatory
requirements and constraints;
Discussion is
facilitated by creating a question using a ‘whatif’ phrase and a prompt word or
subject. The ‘whatif’ phrases to be used are “what if…”, “what would happen
if…”, “could someone or something…”, “has anyone or anything ever….” The intent
is to stimulate the study team into exploring potential scenarios, their causes
and consequences and impacts. The risks identified are summarized and the team
considers the controls already in place, assuming that there are any – before
confirming the description of the risk, its causes, consequences and expected
controls. This information is then recorded.
The application of
this team based model doesn’t have to be complex, since ISO 31010 simply rates
the Complexity of the technique as “Any”.
10. Scenario Analysis
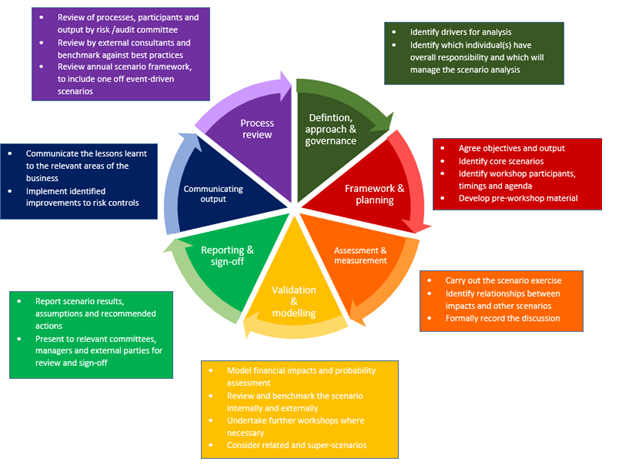 Scenario analysis
is a process of analyzing possible future events by considering alternative
outcomes (sometimes called “alternative worlds”).The technique can be used to identify
risks by considering sets of scenarios that reflect, i.e. ‘best case’, ‘worst
case’ and ‘expected case’, in order to analyze potential consequences and their
probabilities for each scenario as a form of sensitivity analysis when analyzing
the risk. ‘The possible future scenarios or ‘alternative worlds’ are
identified… “…through imagination or extrapolation from the present and
different risks considered assuming each of these scenarios might occur. This
can be done formally or informally, qualitatively or quantitatively.”
Scenario analysis
is a process of analyzing possible future events by considering alternative
outcomes (sometimes called “alternative worlds”).The technique can be used to identify
risks by considering sets of scenarios that reflect, i.e. ‘best case’, ‘worst
case’ and ‘expected case’, in order to analyze potential consequences and their
probabilities for each scenario as a form of sensitivity analysis when analyzing
the risk. ‘The possible future scenarios or ‘alternative worlds’ are
identified… “…through imagination or extrapolation from the present and
different risks considered assuming each of these scenarios might occur. This
can be done formally or informally, qualitatively or quantitatively.”
11.
Business Impact Analysis (BIA)

A Business Impact
Analysis identifies an organization’s exposure to internal and external threats
and synthesizes hard and soft assets to provide effective prevention and
recovery for the organization, while maintaining competitive advantage and
value system integrity. The analysis provided by a conscientiously-conducted
BIA could be of value when determining “…the external and internal issues that
are relevant to the organization’s purpose … and that affect its ability to
achieve the intended result(s) of its quality management system”; as well as
helping to determine who are “the interested parties”, and the requirements of
these interested parties that are relevant to the quality management system (Clause
4, ISO 9001:2015 Context of the organization). If your organization already has
a business continuity management system (BCM) based on the ISO 22301 Standard
and since a BIA is a mandatory document, seeking out your Business Continuity
Manager to obtain the BIA report could be a sound move at this point. You will
then have a valuable item of documented information to show risk-based thinking
in case you are audited for ISO 9001:2015, because you will have assessed (by
means of the BIA) how key disruption risks could affect an organization’s
operations and identified/quantified the capabilities that would be required to
manage it.
12. Root Cause Analysis

Root cause analysis
(RCA) is a process designed for use in investigating and categorizing the root
causes of events with safety, health, environmental, quality, reliability and
production impacts. The term “event” is used to generically identify
occurrences that produce or have the potential to produce these types of
consequences. Simply stated, RCA is a tool designed to help identify not only
what and how an event occurred, but also why it happened. Only when
investigators are able to determine why an event or failure occurred will they
be able to specify workable corrective measures that prevent future events of
the type observed. Understanding why an event occurred is the key to developing
effective recommendations.
Root
cause analysis helps identify what, how and why something happened, thus
preventing recurrence.
Root
causes are underlying, are reasonably identifiable, can be controlled by
management and allow for generation of recommendations.
The
process involves data collection; cause charting, root cause identification and
recommendation generation and implementation.
RCAs should
generally follow a pre-specified protocol that begins with data collection
and reconstruction of the event in question through record review and
participant interviews. A multidisciplinary team should then analyze the
sequence of event leading to the error, with the goals of identifying how the
event occurred (through identification of active errors) and why the event
occurred (through systematic identification and analysis of latent errors). The
ultimate goal of RCA is to prevent future harm by eliminating the latent errors
that so often underlie adverse events.
Step I—data
collection
The first step in
the analysis is to gather data. Without complete information and an
understanding of the event, the causal factors and root causes associated with
the event cannot be identified. The majority of time spent analyzing an event
is spent in gathering data.
Step II—Causal
factor charting
 Causal factor
charting provides a structure for investigators to organize and analyze the
information gathered during the investigation and identify gaps and
deficiencies in knowledge as the investigation progresses. The causal factor
chart is simply a sequence diagram with logic tests that describes the events
leading up to an occurrence, plus the conditions surrounding these events.
Preparation of the causal factor chart should begin as soon as investigators
start to collect information about the occurrence. They begin with a skeleton
chart that is modified as more relevant facts are uncovered. The causal factor
chart should drive the data collection process by identifying data needs. Data
collection continues until the investigators are satisfied with the
thoroughness of the chart (and hence are satisfied with the thoroughness of the
investigation). When the entire occurrence has been charted out, the
investigators are in a good position to identify the major contributors to the
incident, called causal factors. Causal factors are those contributors (human
errors and component failures) that, if eliminated, would have either prevented
the occurrence or reduced its severity. In many traditional analyses, the most
visible causal factor is given all the attention. Rarely, however, is there
just one causal factor; events are usually the result of a combination of
contributors. When only one obvious causal factor is addressed, the list of
recommendations will likely not be complete. Consequently, the occurrence may
repeat itself because the organization did not learn all that it could from the
event.
Causal factor
charting provides a structure for investigators to organize and analyze the
information gathered during the investigation and identify gaps and
deficiencies in knowledge as the investigation progresses. The causal factor
chart is simply a sequence diagram with logic tests that describes the events
leading up to an occurrence, plus the conditions surrounding these events.
Preparation of the causal factor chart should begin as soon as investigators
start to collect information about the occurrence. They begin with a skeleton
chart that is modified as more relevant facts are uncovered. The causal factor
chart should drive the data collection process by identifying data needs. Data
collection continues until the investigators are satisfied with the
thoroughness of the chart (and hence are satisfied with the thoroughness of the
investigation). When the entire occurrence has been charted out, the
investigators are in a good position to identify the major contributors to the
incident, called causal factors. Causal factors are those contributors (human
errors and component failures) that, if eliminated, would have either prevented
the occurrence or reduced its severity. In many traditional analyses, the most
visible causal factor is given all the attention. Rarely, however, is there
just one causal factor; events are usually the result of a combination of
contributors. When only one obvious causal factor is addressed, the list of
recommendations will likely not be complete. Consequently, the occurrence may
repeat itself because the organization did not learn all that it could from the
event.
Step III—root cause
identification
 After all the
causal factors have been identified, the investigators begin root cause
identification. This step involves the use of a decision diagram called the
Root Cause Map to identify the underlying reason or reasons for each causal
factor. The map structures the reasoning process of the investigators by
helping them answer questions about why particular causal factors exist or
occurred. The identification of root causes helps the investigator determine
the reasons the event occurred so the problems surrounding the occurrence can
be addressed.
After all the
causal factors have been identified, the investigators begin root cause
identification. This step involves the use of a decision diagram called the
Root Cause Map to identify the underlying reason or reasons for each causal
factor. The map structures the reasoning process of the investigators by
helping them answer questions about why particular causal factors exist or
occurred. The identification of root causes helps the investigator determine
the reasons the event occurred so the problems surrounding the occurrence can
be addressed.
Step
IV—recommendation generation and implementation
The next step is
the generation of recommendations. Following identification of the root causes
for a particular causal factor, achievable recommendations for preventing its
recurrence are then generated. The root cause analyst is often not responsible
for the implementation of recommendations generated by the analysis. However,
if the recommendations are not implemented, the effort expended in performing
the analysis is wasted. In addition, the events that triggered the analysis
should be expected to recur. Organizations need to ensure that recommendations
are tracked to completion.
RCA assumes that
systems and events are interrelated, whereas an action in one area triggers an
action in another, and another, and so on. By tracing back these actions, you
can discover where the problem started and how it grew into the symptom you’re
now facing.
No comments:
Post a Comment